U.S. Bank: Survived The Great Depression, May Not Survive The Next One?
The latest in our "Is Your Bank Safe?" series, this one titled, "U.S. Bank: Survived The Great Depression, May Not Survive The Next One?"
Over the last year, we have written a number of articles outlining our views of banks in general. We explained the relationship that you, as a depositor, have with your bank is in line with a debtor/creditor relationship. This places you in a precarious position should the bank encounter financial or liquidity issues. Moreover, we also outlined why reliance on the FDIC may not be wholly advisable. And, finally, we explained that the next time there's a financial meltdown, your deposits may be turned into equity to assist the bank in reorganizing.
So, at the end of the day, it behooves you, as a depositor, to seek out the strongest banks you can find, and to avoid banks which have questionable stability.
While we outlined in our last articles the potential pitfalls we foresee with regard to various banks in the foreseeable future, we also have provided you with a deeper understanding as to why we see the larger banks as having questionable stability. Over the coming year, we intend to continue to publish articles outlining our views on this matter.
First, we want to explain the process with which we review the stability of a bank.
We focus on four main categories which are crucial to any bank’s operating performance. These are: 1) Balance Sheet Strength; 2) Margins & Cost Efficiency; 3) Asset Quality; 4) Capital & Profitability. Each of these 4 categories is divided into 5 subcategories, and then a score ranging from 1-5 is assigned for each of these 20 sub-categories:
If a bank looks much better than the peer group in the sub-category, it receives a score of 5.
If a bank looks better than the peer group in the sub-category, it receives a score of 4.
If a bank looks in-line with the peer group in the sub-category, it receives a score of 3.
If a bank looks worse than the peer group in the sub-category, it receives a score of 2.
If a bank looks much worse than the peer group in the sub-category, it receives a score of 1.
Afterwards, we add up all the scores to get our total rating score. To make our analysis objective and straightforward, all the scores are equally weighted. As a result, an ideal bank gets 100 points, an average one 60 points, and a bad one 20 points.
If you would like to read more detail on our process for evaluating a bank, feel free to read it here:
Our Methodology & Ranking System: Banks - SaferBankingResearch
But, there are also certain “gate-keeping” issues which a bank must overcome before we even score that particular bank. And, many banks present “red flags,” which cause us to shy away from even considering them in our ranking system.
As mentioned before, it's difficult to overestimate the importance of a deeper analysis when it comes to choosing a really strong and safe bank. There are quite a lot of red flags to which many retail depositors may not pay attention, especially in a stable market environment. However, those red flags are likely to lead to major issues in a volatile environment. Below we highlight some of the key issues that we're currently seeing when we take a closer look at U.S. Bancorp (NYSE:USB).
Large exposure to commercial and CRE lending
Commercial and CRE (Commercial Real Estate) loans corresponded to almost 50% of USB’s total credit portfolio as of the end of the nine months of 2022.

Company Data
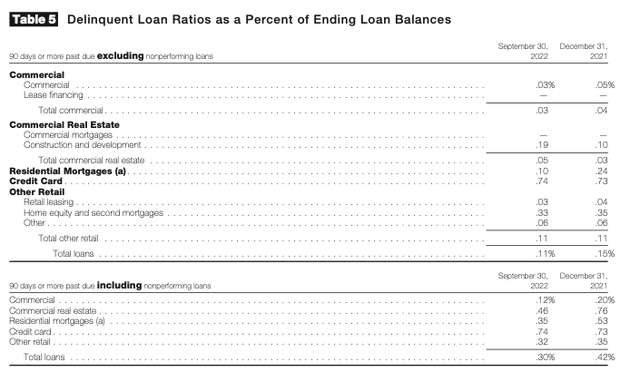
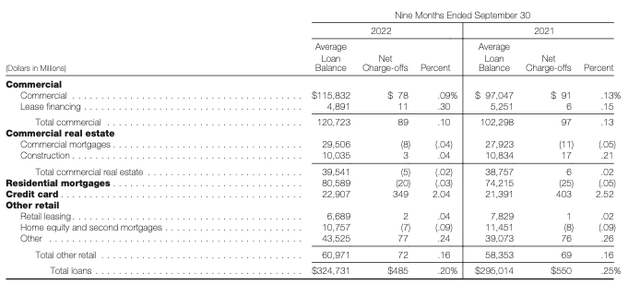
As the tables below show, both delinquency and charge-off ratios are currently rather low and below those of the bank’s retail book. With that being said, the history tells us that commercial and CRE lending are quite vulnerable to changes in macroeconomic conditions. If a major recession comes, asset quality of this credit segment will likely deteriorate rapidly, and there will be significant increases in the bank’s charge-off and NPL ratios.

Company Data

Company Data
Non-interest income is highly sensitive to economic conditions
USB has quite a high share of fee & commission (non-interest) income. For the nine months of 2022, USB’s non-interest income was 41% of the bank’s total operating revenue, which is a very good metric for the U.S. banking sector. Fees do not bear credit risk and are less sensitive to changes in interest rates and in a broader macroeconomic environment, and, as a result, fee & commission income is a more stable and conservative source of revenue for banks compared to interest income. As such, some banking experts often say that USB’s high share of non-interest income is an important competitive advantage of the bank and makes its revenue resilient to changes in economic conditions. However, a closer look at a breakdown of USB’s fee & commission income tells us a different story.
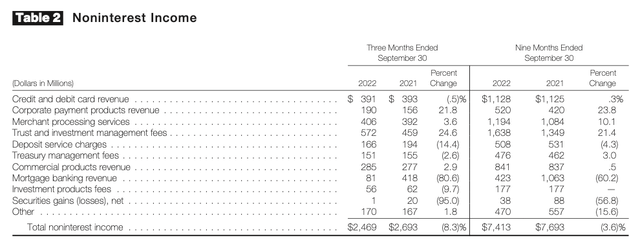
As the table below shows, the majority of the bank’s fees are being generated by merchant processing services, commercial products, and corporate payment products. Although these three segments do not bear credit risks, they're quite volatile and sensitive to changes in a macroeconomic environment. Should a recession come, revenue from these segments will very likely be under pressure.

Company Data
It's also worth noting that USB’s provides merchant processing and corporate trust services in Europe, and, according to the bank, revenue generated from sources in Europe represented approximately 2% of its total revenue for the nine months of 2022. This implies that quite a large part of USB’s fees is exposed to European risks, including FX-related ones.
Lastly, as the table shows, there was a 60% YoY decline in the bank’s mortgage banking revenue. According to the bank, mortgage banking revenue decreased primarily due to lower application volume, given declining refinance activities experienced in the mortgage industry, lower related gain on sale margins and lower performing loan sales. Indeed, there was a slowdown in the mortgage market. However, it was relatively mild and it's quite a negative surprise that it led to such a decline in the bank’s mortgage banking revenue. This is another demonstration that USB’s fee & commission income is highly sensitive to macroeconomic changes.
Longer-duration securities book could lead to liquidity issues
As of the end of the nine months of 2022, USB had $154B of securities on its balance sheet, based on the amortized cost. This amount corresponds to 26% of the bank’s total assets.
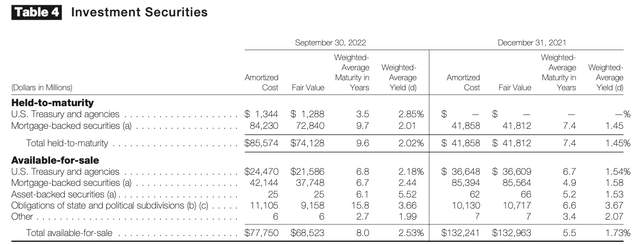
Below is a breakdown of USB’s securities book. Mortgages-backed securities represent 98% of the bank’s HTM (held-to-maturity) portfolio, and their weighted-average maturity is 9.7 years. If we look at the bank’s AFS (available-for-sale) portfolio, its duration is a tad shorter. However, 86% of the AFS segment are U.S Treasuries and MBS with maturity of almost seven years.

Company Data
Longer-duration bonds are very sensitive to changes in the market yields. The bank does not disclose the average duration of its deposits. However, it's highly likely that it's lower than that of its securities portfolio. As a result, such a maturity mismatch could lead to major liquidity issues in a crisis environment
Double-digit decline in non-interest-bearing deposits
A high share of non-interest-bearing deposits had been one of the key advantages of USB’s business model for quite a time. This was viewed as a strength of USB’s franchise. However, in 2022, USB experienced a significant drop in its non-interest-bearing deposits. As of the end of 9M22, the bank’s non-interest-bearing deposits fell by 15% YTD. This raises a question about whether the bank’s customers still believe USB is a high-quality deposit franchise.

Company Data
By comparison, most of the bank we have identified were enjoying inflows of noninterest-bearing deposits last year.
Operating efficiency is on the weaker side
For the nine months of 2022, USB’s cost-income ratio was 61%, which is quite a high metric even for large U.S banks as the average cost-income ratio of the U.S. banks with assets greater than $100B was 55% for the same time period.

Company Data
Given that USB’s non-interest revenue is sensitive to a macroeconomic environment, even a mild increase in loan loss provisions would likely make USB a loss-making entity.
By comparison, the majority of the banks that we have identified at SaferBankingResearch.com have cost-to-income ratios in the range of high 30s% to low 50s%.
Capital adequacy ratios look low for a corporate-focused bank
USB’s CET1 ratio was 9.7% as of the end of 9M22.

Company Data
We believe it's a low metric for a commercial-focused bank such as USB. The bank’s risk-weighted assets are very likely to increase significantly in a crisis environment given its exposure to commercial and CRE lending. USB’s CET1 ratio is also much lower than that of the U.S banks with assets of more than $100B, which was 14%.
The bottom line
USB looks better than some of the other Wall Street banks. However, it still has a lot of red flags, which are very likely to lead to serious issues in a major crisis environment. In contrast to USB, the Top-15 U.S banks we have found at Saferbankingresearch.com have very low exposure to risky commercial and CRE lending, and their non-interest revenue is less volatile. The banks we have identified also have lower shares of longer duration bonds, and they were recording inflows of non-interest-bearing deposits in 2022. Lastly, their capital positions are much stronger than that of USB.
So, we strongly urge caution for those that choose to deposit their money in U.S. Bank.

