Big Banks Have Massive Exposure: A Review Of PNC Bank
As part of our ongoing series of articles on bank stability, we wanted to address PNC Bank (PNC) in this missive. I want to take this opportunity to remind you that we have reviewed many larger banks in our public articles, and you can read them all here. But, I must warn you. The substance of that analysis is not looking too good for the future of the larger banks in the United States. You can read them here.
Large exposure to commercial and industrial lending
As of the end of last year, PNC's total commercial loans accounted for almost 70% of the bank's total credit portfolio. This is one of the highest shares among the 50 largest U.S. banks.
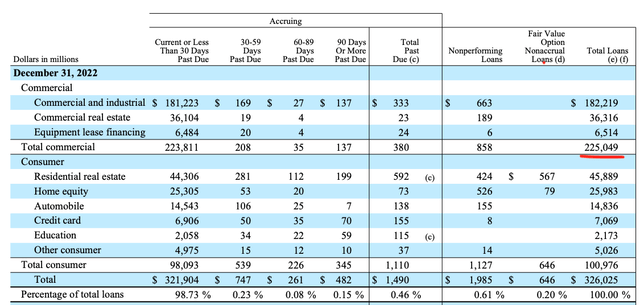
Company Data
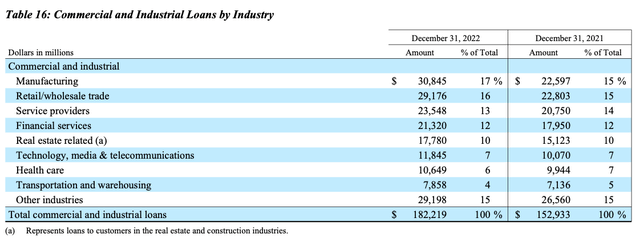
Below is a breakdown of PNC's commercial and industrial loans by industry.
Company Data
At this time, both the delinquency and charge-off ratios are relatively low. Having said that, the past has shown us that changes in the macroeconomic environment can significantly affect commercial lending. In the event of a severe recession, the asset quality of this credit category is expected to rapidly deteriorate, leading to significant rises in the charge-off and NPL ratios for the bank.
High share of uninsured commercial deposits
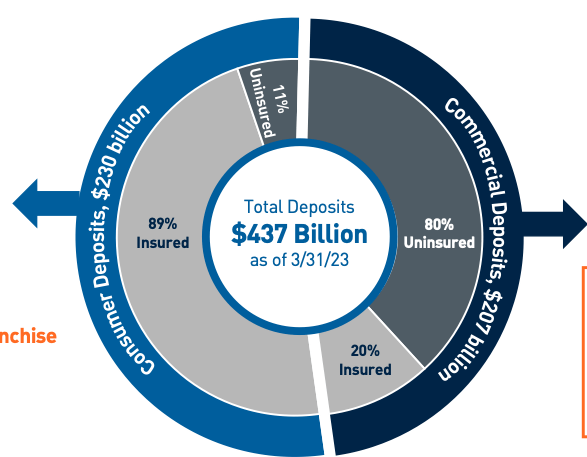
As of the end of the first quarter of 2023, PNC had retail deposits of $230B and commercial deposits of $207B. The bank's retail deposit base looks granular, with 89% of deposits being FDIC-insured, i.e., less than $250K per account. However, PNC's commercial deposits look completely different, as 80% of them are uninsured. As a reminder, high shares of uninsured commercial deposits were the reasons for both the SVB and Signature Bank failures.
Company Data
Significant increase in expensive FHLB's borrowings
In its latest 10-Q, the bank mentioned the following:
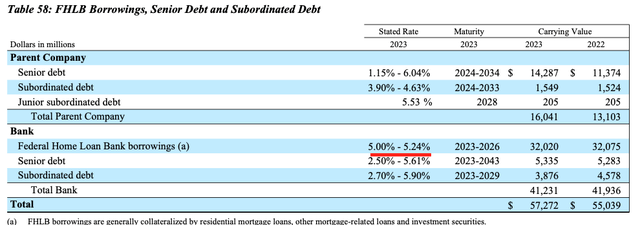
Average borrowed funds of $63.0 billion for the first quarter of 2023 increased $3.7 billion, or 6%, compared to the fourth quarter of 2022, driven by parent company senior debt issuances in January 2023. Compared to the first quarter of 2022, average borrowed funds increased $32.7 billion, or 108% due to increased FHLB borrowings and senior debt issuances.
As the table below shows, FHLB's borrowings are quite expensive for the bank, as their stated rate ranges from 5.00% to 5.24%. PNC borrowed more than $30B at this rate since Q122. For comparison, the bank's average deposit cost is much lower at 1.66% for Q123.
Company Data
The table below shows that PNC did not have any FHLB's borrowings as of the end of the first quarter of 2022. As a result of these borrowings, PNC's total funding cost spiked from just 13 bps as of Q122 to 220 bps as of Q123. The fact that PNC attracted this expensive funding may indicate the bank does have some liquidity issues.

Company Data
Longer-duration securities book could lead to liquidity problems
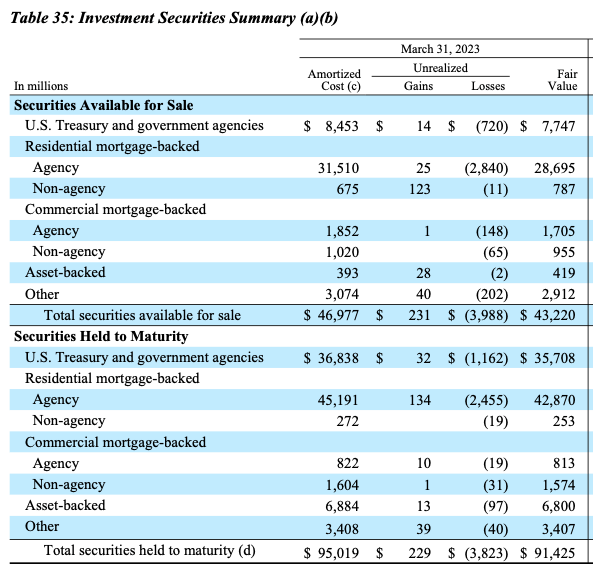
PNC had more than $130B in securities at amortized cost as of the end of the first quarter, of which $47B were available-for-sale securities and the rest $95B were held-to-maturity securities.
Company Data
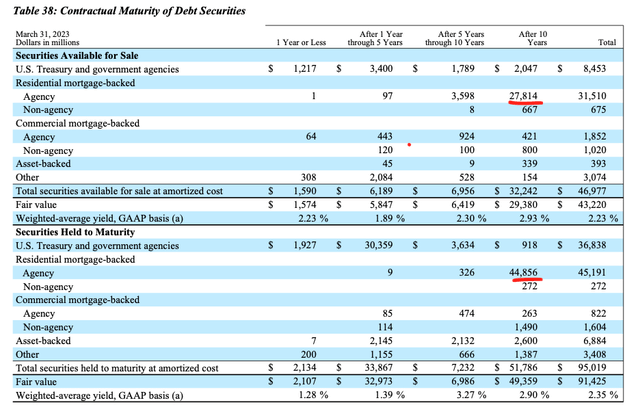
We have been consistently warning about the duration mismatch risk in our previous articles on large banks. For SVB, this risk has materialized and led to its failure. PNC is a good example of how large U.S. banks still have duration mismatch risk due to their longer-term securities portfolio.
As the table below shows, 86% of PNC's available-for-sale securities and 87% of its held-to-maturity securities have maturities of more than 10 years.
Company Data
The recent bank failures have already demonstrated that such a longer-duration securities book is a major risk.
Operating efficiency is worse than that of its peers
For the full year of 2022, the bank's cost-income ratio was 62%, which is quite a high metric even for large U.S. banks, as the average cost-income ratio of the U.S. banks with assets greater than $100B was 54% for the same time period.
Obviously, banks with weaker operating efficiency would be more vulnerable in a systemic crisis environment.
Capital adequacy ratios look low, especially when adjusted for AOCI
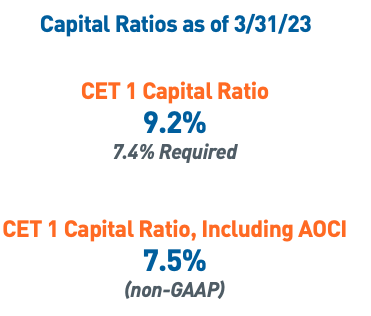
PNC's CET1 ratio was 9.2% as of the end of the first quarter. Based on the 2022 Fed's stress test results, the requirement for the bank's CET1 is 7.4%.
Company Data
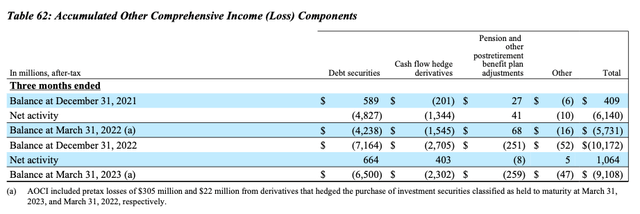
However, PNC has a negative AOCI (Accumulated Other Comprehensive Income) of $9.1B. Below is a breakdown of it.
Company Data
Adjusted for this loss, PNC's CET1 ratio is 7.5%, which is just 10 bps above the Fed's requirement. Such a small capital position would be a major issue for the bank in a systemic crisis scenario.
The bottom line
As you can see, PNC has a number of issues which could come to the foreground in the event the market begins to move into a difficult economic environment.
In contrast to PNC, the Top-15 U.S. banks we have found at SaferBankingResearch have low exposure to commercial lending, rely on much cheaper funding, have better operating efficiency, and have much higher capital adequacy ratios. The banks we have identified also have lower shares of longer-duration bonds.
At the end of the day, we're speaking of protecting your hard-earned money. Therefore, it behooves you to engage in due diligence regarding the banks which currently house your money. You have a responsibility to yourself and your family to make sure your money resides in only the safest of institutions. And, if you are relying on the FDIC, I suggest you read our prior articles which outline why such reliance will not be as prudent as you may believe in the coming years.
It is time for you to do a deep dive on the banks that house your hard-earned money in order to determine whether your bank is truly solid or not. And, you can feel free to utilize the methodology we outline here.

